
After interviewing 2,200+ founders and tracking their companies over time, one finding stood out: growth rarely creates new problems. It magnifies existing ones. The founders who measured the wrong things early didn't just waste time. They built confidence in metrics that actively misled them.
Startup traction metrics are the numbers investors use to assess whether a company is making real progress. The challenge is that not every metric tells the truth. Some look impressive in a pitch deck but reveal nothing about the health of the business. Others are small in absolute terms but signal genuine product-market fit. Knowing which is which is half the job of evaluation.
The difference between useful and misleading traction data comes down to two factors: what you measure and when you measure it. A metric that's irrelevant at Phase 2 becomes the most important number at Phase 5.
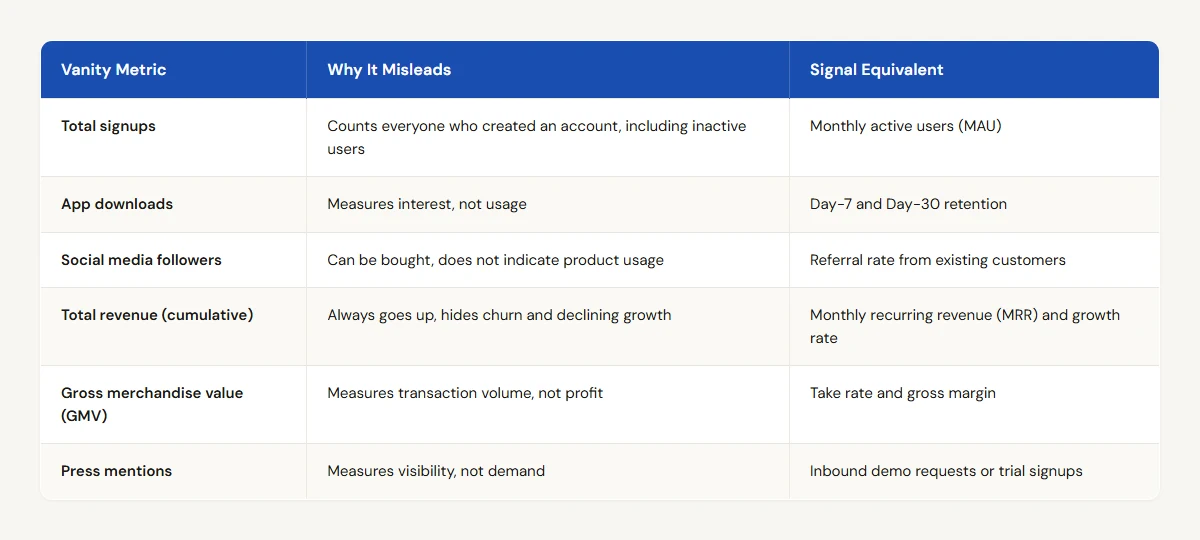
Vanity Metrics vs. Signal Metrics
Vanity metrics are numbers that make a company look good without indicating whether the business model works.
Metrics by Lifecycle Stage
The most useful traction framework ties metrics to the company's current phase. What counts as meaningful progress changes as the startup matures.
Phase 2 (Product). The company is building. Meaningful metrics at this stage are sparse and that's expected.
- User interviews completed
- Prototype iteration cycles
- Beta user engagement (session frequency, feature usage)
- Waitlist signups (with caveats: waitlists are interest, not commitment)
Phase 3 (Go-to-Market). The company is selling. This is where traction starts to matter for investment decisions.
- Customer count (paying, not just signed up)
- Monthly recurring revenue (MRR)
- Customer acquisition cost (CAC)
- Activation rate (percentage of signups who become active users)
- Early retention (30-day, 60-day, 90-day cohorts)
Phase 4 (Standardization). The company is building repeatable processes. Metrics shift from "can we get customers" to "can we do it consistently."
- Revenue growth rate (month-over-month)
- Churn rate (monthly and annual)
- LTV:CAC ratio
- Sales cycle length
- Employee-to-customer ratio
Phase 5 (Optimization). The company is improving efficiency. The business model should be proven, and the question is how profitable it can become.
- Gross margin
- Net revenue retention
- Payback period on customer acquisition
- Operating use (revenue growth vs. cost growth)
- Rule of 40 (growth rate + profit margin). According to Brad Feld, a healthy software company's growth rate plus profit margin should sum to at least 40%, a benchmark he popularized in 2015 after hearing it from a late-stage investor.1
Phase 6-7 (Growth and Exit). The company is scaling or preparing for an exit. Metrics at this stage are about capital efficiency and market position.
- Market share
- Revenue per employee
- Free cash flow
- Expansion revenue percentage
- Competitive win rate
The Self-Reporting Problem
Here's the uncomfortable reality with traction metrics: they come from the founder. A revenue number in a pitch deck is a claim. A customer count on a slide is an assertion. Without verification, every metric carries the bias of the person presenting it.
Common ways founders present traction favorably without lying:
- Reporting annualized revenue based on one strong month
- Counting free trial users as "customers"
- Measuring growth rate from a cherry-picked low point
- Blending paying and non-paying users in engagement metrics
- Projecting LTV from less than six months of data
None of this is necessarily deceptive. Optimistic interpretation is what motivated founders do. The investor's job is to verify.
For investors working with platforms that track verified activity data, like Startup Science, the traction baseline is more reliable because it comes from actual platform behavior rather than founder-curated numbers. A startup's lifecycle phase, milestones completed, and ESO program participation are tracked independently of what the founder reports.
Applying This to Evaluation
When reviewing traction in a pitch or during due diligence, match the claimed metrics against the expected metrics for the company's lifecycle phase. If a Phase 3 company is reporting Phase 5 metrics (gross margin, net revenue retention), ask how they calculated them with limited data. If a Phase 5 company can't produce basic unit economics, that's a flag.
The right metric at the right stage tells you whether the company is on track. The wrong metric at any stage tells you nothing.
Stop guessing at traction. See startups with verified metrics on Startup Science.
What the Data Actually Shows
One founder in our dataset reported $50K MRR during a seed round. Verified bank statements showed $31K. The gap came from counting annual contracts as monthly revenue. The founder had booked a $228K annual deal three months earlier and divided it by twelve for the pitch deck, but the cash was hitting the account quarterly. Investors caught it during diligence, and the round stalled for six weeks while the founder rebuilt the financial model. A different pattern showed up with engagement metrics. A B2B SaaS founder claimed 4,200 monthly active users in a pre-Series A deck. When the lead investor pulled event logs, 3,100 of those "active" users had only triggered a single login during the trailing 30 days. The founder's definition of "active" included anyone who opened the app, even if they closed it within seconds. Redefining "active" as users who completed at least one core workflow dropped the count to 890. The round still closed, but at a lower valuation, and the investor required monthly cohort reporting as a board condition.
The Rule of 40: How to Calculate It
The Rule of 40 adds your revenue growth rate (year-over-year percentage) to your profit margin (EBITDA or free cash flow margin as a percentage). A SaaS company growing at 60% YoY with a negative 15% margin scores 45, which clears the threshold. During Phase 3 (product-market fit) and Phase 4 (scaling), scores below 40 are common and acceptable because founders are investing heavily in acquisition. By Phase 5 (optimization), investors expect the score to approach or exceed 40 as unit economics stabilize. Companies that sustain a Rule of 40 score above 60 for multiple quarters are typically in the top decile of their peer group, regardless of whether growth or margin drives the number.
Insert as a quick-reference card in the body, ideally after the section that discusses lifecycle-phase differences.
Metrics Investors Ask For by Phase
| Phase | Key Metrics | What "Good" Looks Like |
|---|---|---|
| Pre-Seed (Ideation / Validation) | Founder-market fit evidence, customer discovery interviews completed, waitlist signups, LOIs or pilot commitments | 30+ discovery interviews, 3+ LOIs, waitlist conversion above 15% |
| Seed (Early Traction) | MRR, MoM growth rate, activation rate, CAC, early retention (Week 4 or Month 1) | $10K-$50K MRR, 15-20% MoM growth, activation above 25%, Month-1 retention above 40% |
| Series A (Scalable Growth) | ARR, net revenue retention (NRR), LTV:CAC ratio, payback period, gross margin, cohort retention curves | $1M-$3M ARR, NRR above 110%, LTV:CAC above 3:1, payback under 18 months, gross margin above 60% |
| Series B (Expansion) | Revenue growth rate, Rule of 40 score, sales efficiency (magic number), expansion revenue %, churn segmented by cohort | 2-3x YoY growth, Rule of 40 above 40, magic number above 0.75, net churn negative, expansion revenue above 20% of new ARR |
| Growth / Late Stage | Gross margin trajectory, FCF margin, burn multiple, revenue per employee, market share gains | Gross margin above 70%, burn multiple below 2x, revenue per employee above $200K, clear path to profitability |
Frequently Asked Questions
Insert as a new section near the end of the article, before the internal linking map.
What is a good MRR growth rate for an early-stage startup?
Seed-stage SaaS companies that attract Series A interest typically grow MRR between 15% and 25% month-over-month for at least three to four consecutive months. Below 10% MoM, most institutional investors will wait for acceleration before engaging. Context matters: a founder growing 12% MoM with 95% net retention and low CAC may attract more interest than one growing 30% MoM through paid channels with 60-day payback periods and high churn. Gregory Shepard's dataset across 89,000+ founders shows that the strongest predictor of fundraising success at seed isn't peak growth rate but sustained growth with stable or improving unit economics over a trailing 90-day window.
What is the Rule of 40 for startups?
The Rule of 40 is a benchmark that combines revenue growth rate and profit margin into a single number. You add year-over-year revenue growth (as a percentage) to EBITDA or free cash flow margin (as a percentage). A company growing 50% YoY with a negative 20% margin scores 30, which falls short. The same company at negative 5% margin scores 45, which clears the bar. The benchmark originated in growth-stage SaaS investing, but founders preparing for Series B and beyond should track it quarterly. Scores above 40 signal that a company balances growth investment with improving economics. Scores above 60 place a company in the top tier of its stage cohort.
What traction metrics do Series A investors care about most?
Series A investors focus on five metrics: ARR (typically $1M-$3M minimum), net revenue retention above 110%, LTV:CAC ratio above 3:1, CAC payback under 18 months, and cohort-level retention curves that flatten rather than decline to zero. The shift from seed to Series A diligence is the shift from "is there signal?" to "does this scale?" Investors will reconstruct your cohort data independently, so founders should have clean, exportable retention tables segmented by acquisition month and channel. Self-reported top-line numbers without cohort support rarely survive a first partner meeting.
What's the difference between vanity metrics and signal metrics?
Vanity metrics measure activity without connecting it to business outcomes. Total registered users, app downloads, page views, and social followers are vanity metrics because they grow passively and don't correlate with revenue or retention. Signal metrics measure behavior that predicts or drives value: activation rate, weekly active users who complete a core workflow, net revenue retention, and expansion revenue percentage. The test is simple. If the metric can grow while the business deteriorates, it's vanity. If it can only grow when customers get value, it's signal. Founders should track both for internal context, but pitch decks that lead with vanity metrics signal inexperience to investors who've seen the pattern hundreds of times.
How do you track traction metrics before generating revenue?
Pre-revenue founders track engagement proxies that predict future willingness to pay. The strongest signals are usage frequency (daily or weekly active users returning without prompts), depth of engagement (time in core workflow, features used per session), and organic referral rate (users inviting others without incentive). Waitlist conversion rate, LOI signatures, and pilot commitments from paying design partners also count as pre-revenue traction. Gregory Shepard recommends that pre-revenue founders build a metrics dashboard from day one, even if the numbers are small. Three months of consistent weekly engagement data from 50 users tells a stronger story than a launch-week spike of 5,000 signups that decays to 200 within a month.